Learn how to utilise filters to enhance your dashboards.
Your dashboard filter tags are an essential feature to make the most of your data and allows you to see and manage your currently applied/active filters.
The filter tags are visual indicators displayed at the top of your SafetyInsights dashboard, which show the currently applied/active filters currently applied to your data and visualisations. They can help you to quickly identify and adjust which filters are influencing your data
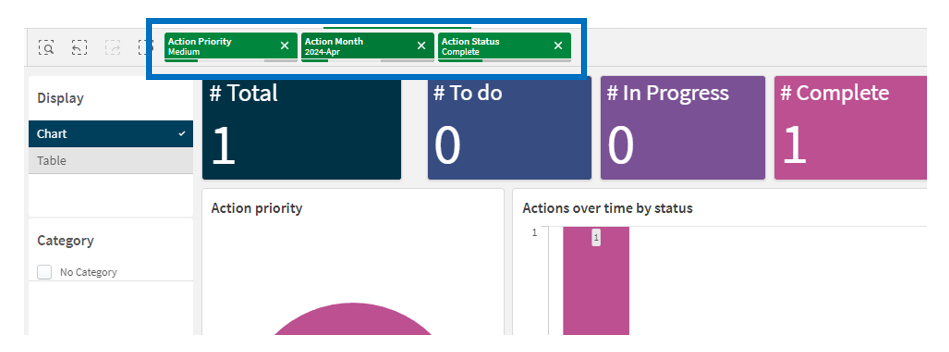
When a filter is applied, a tag appears at the top of the dashboard. For example, if the “Low” Action Priority is selected, a tag like “Action Priority: Low” will appear as shown in the preview below.
The top of the filter tag is the attribute you are filtering on and the bottom of the filter tag is the value or selection of attribute.
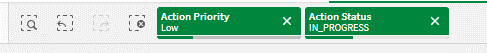
You may see multiple filter tags if you have more than 1 filter applied to your data. For example, if you filter by both “Low” and the status “IN_PROGRESS”, tags such as “Action Priority: Low” and “Action Status: IN_PROGRESS” will be displayed.
In the example below, only data will be shown which are currently in progress and with a priority of ‘Low’
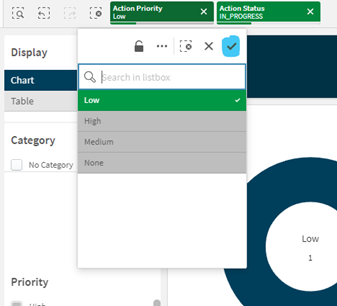
If you have filters applied to your data, you can easily change what you’re filtering on by clicking on the filter tag. You can see in the preview below, a pop-out box will appear listing the possible options.
Any options that are ticked (in this case, ‘Low’) are currently selected to be used as filters. You can toggle this option on or off by clicking on that option, so the tick disappears. You can also select multiple values by clicking on each of the corresponding option and then clicking the ‘✓’ button on the top of the pop-up (highlighted in blue) to confirm
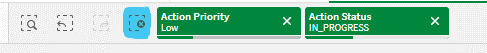
By clicking on the ‘X’ button against each filter tag, you can remove that particular filter. You can also remove all of your filters by clicking on the highlighted blue ‘Clear filters’ icon next to your filter tags
- Monitor Active Filters
Always keep an eye on the filter tags to ensure you are aware of which filters are applied, especially when making complex analyses. - Quick Adjustments
Use the filter tags for rapid adjustments without going back to the filter panel, enhancing your workflow efficiency. - Clear Filters
If the data shown seems off or too restricted, check the filter tags first to ensure no unintended filters are applied.