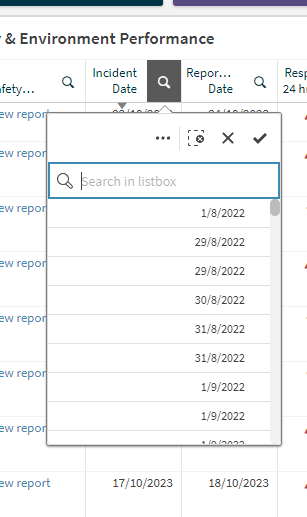
Some charts allow you to search through your data using your keyboard – if you see a magnifying glass next to any field, you can click this to show the search dialog. In this dialog you can enter a search term (including using things like '*' for a wildcard search) and press 'Enter' or click the ✔️ button
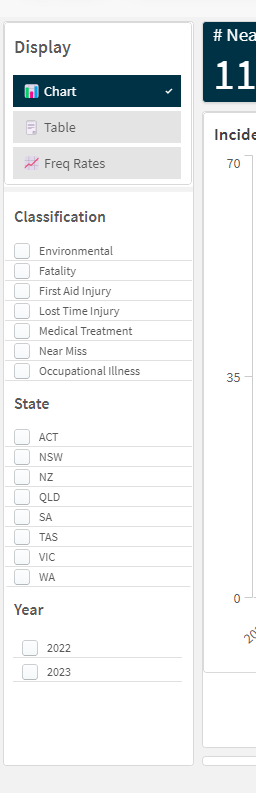
Our dashboards always include an easy to use filter bar on the left hand side. This enables you to quickly create filters that allow you to gather insights from your data without having to try and scour through a lot of data. You can click on one or more of these filter options to instantly filter your data.
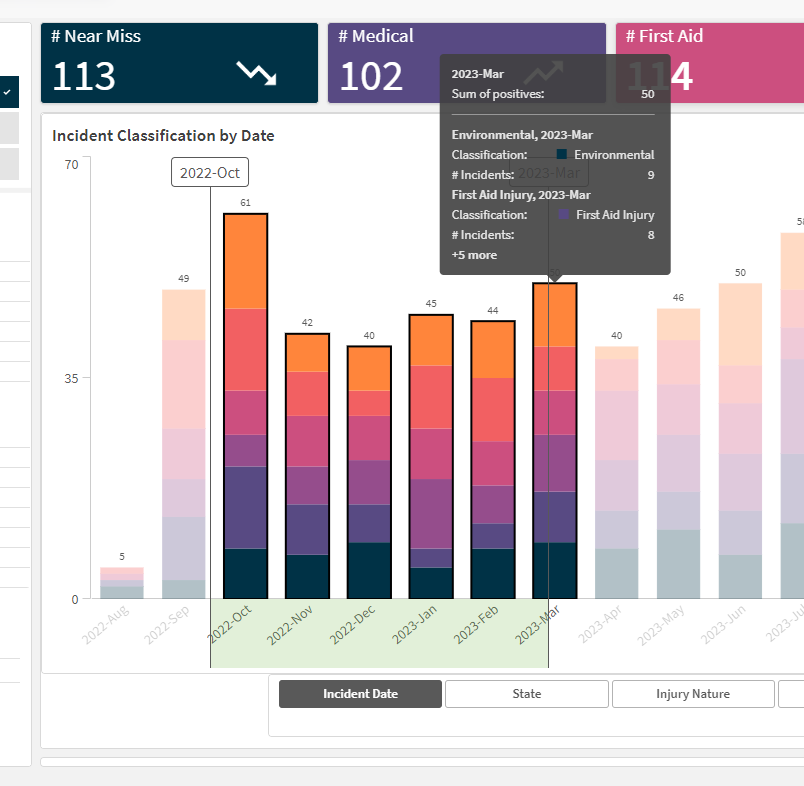
Additionally, almost every visualisation, chart and object is interactive and can be clicked on to activate a filter. This includes:
- Click and dragging across the axis of a chart
- Clicking an item (or more than 1 item) in a table
- Clicking on a part in an image (i.e. a part of the body)
- Clicking on an individual segment in a chart
Once you click to activate a filter, you will see your dashboard visuals are all automatically updated.